
Key Points:
- FSMI Lost 2.3% in May 2012
- Top 5 funds were mostly invested in Malaysian large caps
- Bottom 5 funds were heavily exposed to energy and agriculture commodities
During the month of May, the MSCI AC World Index lost a hefty 4.9% (in RM terms) as Greece's exit from the Eurozone was the topic-of-the-month, ahead of Greek elections on 17 June 2012. And this is against the backdrop of soft global economic data, including data coming from the US. Meanwhile, the possibility of the Federal Reserve embarking on QE3 sooner rather than later has been revived. Consensus estimates on Bloomberg for US and Europe's 2012 real economic growth remain unchanged at 2.3% and -0.4% respectively (as of 4 June 2012).
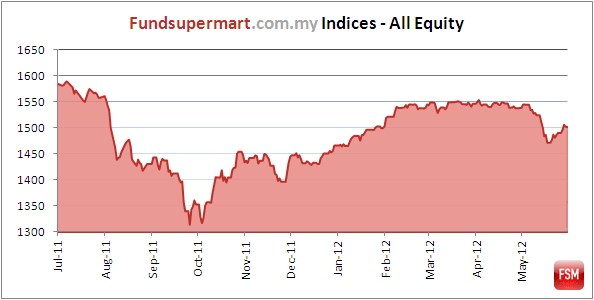
Among the top performers in May were Malaysia, Taiwan and gold equities as the FTSE Bursa Malaysia KLCI, Taiwan TAIEX and FTSE Gold Mines indices returned 0.6%, -0.2% and -0.6% respectively (all in RM terms). The FSMI - All Equity index shed 2.3% month-on-month in the worst month of 2012 thus far.
 Table 1: FSMI - All Equity Performance | |||
 |
|||
Date |
FSMI - All Equity |
Returns |
Returns |
(month-to-date) |
(year-to-date) |
||
30-Jun-11 |
1,572.5 |
-0.3% |
2.8% |
29-Jul-11 |
1,557.7 |
-0.9% |
1.8% |
31-Aug-11 |
1,430.8 |
-8.1% |
-6.5% |
30-Sep-11 |
1,353.0 |
-5.4% |
-11.6% |
31-Oct-11 |
1,447.7 |
7.0% |
-5.4% |
30-Nov-11 |
1,433.3 |
-1.0% |
-6.3% |
31-Dec-11 |
1,465.9 |
2.2% |
-4.2% |
31-Jan-12 |
1,499.7 |
2.3% |
2.3% |
29-Feb-12 |
1,544.8 |
3.0% |
5.4% |
30-Mar-12 |
1,546.1 |
0.1% |
5.5% |
30-Apr-12 |
1,538.0 |
-0.5% |
4.9% |
31-May-12 |
1,502.3 |
-2.3% |
2.5% |
| Source: Fundsupermart.com compilations, as at 31 May 2012. Performance figures in the table are in RM terms, calculated using NAV prices, with any income or dividend reinvested. |
|||
|---|---|---|---|
Domestic Safe Haven For Malaysian Investors
Malaysian large caps (as represented by the FTSE Bursa Malaysia KLCI) were very well shielded from external headwinds mainly originating in the Eurozone. However, small caps were not spared as the benchmark FTSE Bursa Malaysia Small Cap Index lost 4.4% in May. The top 5 funds in table 2 held mostly large cap stocks in the oil & gas and financial sector, save for the Alliance Optimal Income Fund which is diversified into Real Estate Investment Trusts (REITs) and fixed income securities as well.
On the currency exchange front in the month of May 2012, the RM strengthened against the Aussie dollar and euro by 2.1% and 1.6% respectively while at the same time weakened against the US dollar, renminbi and Indonesia rupiah by 4.6%, 3.7% and 1.8%. On a year-to-date basis, the RM has strengthened against the Indian rupee, Aussie dollar, Indonesian rupiah by 5.6%, 4.4%, and 4.4% respectively as of end-May 2012.
Table 2: Top Five Equity Funds in May 2012 |
|||
| Top Five Equity Funds | Market/Sector |
Return (%) |
|
(month-to -date) |
(year-to -date) |
||
| Alliance Optimal Income Fund | Malaysia |
1.6% |
6.2% |
| Affin Islamic Equity Fund | Malaysia |
1.5% |
2.6% |
| Affin Quantum Fund | Malaysia |
1.5% |
4.5% |
| ASM Index Fund | Malaysia |
1.0% |
3.9% |
| Affin Select Growth Fund | Malaysia |
1.0% |
3.9% |
| Source: Fundsupermart.com compilations, as at 31 May 2012. Performance figures in the table are in RM terms, calculated using NAV prices, with any income or dividend reinvested. |
|||
Dropping Like A BRIC
Although May was a very weak month for equities globally, commodities-based economies such as Brazil, Russia and Australia took the brunt of the volatility in equities. The Russian RTS, Brazil Bovespa and S&P/ASX200 lost 18.3%, 13.1% and 9.1% respectively during the month. The commodities that took the largest price hit were crude oil, iron ore and steel products, and agricultural products such as soybean, cotton and crude palm oil. All the bottom 5 funds in table 3 were heavily exposed to companies that extract or produce such commodities.
Table 3: Bottom Five Equity Funds in May 2012 |
|||
| Bottom Five Equity Funds | Market/Sector |
Return (%) |
|
(month-to -date) |
(year-to -date) |
||
| TA BRIC and Emerging Markets Fund |
BRIC |
-9.7% |
-10.3% |
| RHB - GS BRIC Equity Fund | BRIC |
-9.6% |
-5.6% |
| AmBRIC Equity Fund | BRIC |
-9.6% |
-5.3% |
| OSK-UOB Resources Fund | Resources; Asia excluding Japan |
-8.6% |
-5.1% |
| Eastspring Investments Global Basics MY Fund |
Global |
-7.8% |
-4.8% |
| Source: Fundsupermart.com compilations, as at 31 May 2012. Performance figures in the table are in RM terms, calculated using NAV prices, with any income or dividend reinvested. |
|||
Got a comment? An opinion? Maybe an idea? Drop us an email, we'd like to hear from you!