Key Points:
Southeast Asia (SEA) economies are viewed as being the more robust among emerging markets and its financial sectors are developing fast in recent years. In this article, we conducted a health check on the SEA financial sectors. Index Weight
The financial sectors are heavily weighted in each of the region’s respective benchmark indices because of their sizable market capitalisation (see table 1). Market Structure
The degree of financial liberalisation is different in each country. Table 1 shows that local banks are still dominant in Thailand (87%) and Malaysia (81%). Table 1: Overview of Southeast Asia’s Financial Sectors
Total commercial bank assets in Indonesia is split almost evenly between foreign and local banks given that foreign ownership in banks incorporated in Indonesia (both foreign or local names) can go up to 99%. This has attracted foreign investors to form joint ventures in Indonesia or make direct acquisitions of local banks. Meanwhile, regulators in Malaysia and Singapore impose a foreign ownership cap of 30% and 20% respectively. Currently, the central bank of Indonesia is considering to limit the foreign ownership to a maximum of 50%. It claims that such a move would improve corporate governance and strengthen the banking system subsequently. Malaysia, on the other hand, has shown intention to further ease bank ownership rules. Soundness of Banks
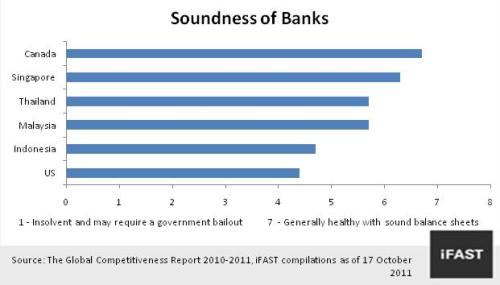
The Global Competitiveness Report 2010 – 2011 put Canadian banks as the world’s soundest banks with 6.7 points out of 7 points. Singapore was rated at 6.3 points whereas Indonesia was relatively low at 4.7 points. Battered banks in the US, the epicentre of the 2008 global financial crisis, came in at 4.4 points. To put this points system into perspective, the number of failed banks in US reached 401 units since February 2007 according to US’s Federal Deposit Insurance Corporation (FDIC).
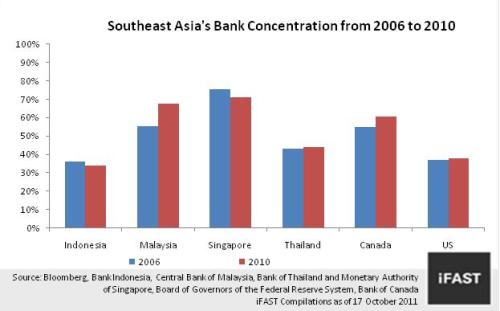
Besides that, Oversea-Chinese Banking Corporation Limited (OCBC Bank) ranked first in the list of top 20 strongest banks in the world according to data compiled by Bloomberg, with DBS Bank Ltd and United Overseas Bank Limited coming in at 5 and 6 respectively. As such, we strongly believe that Singapore banks are the role model for regional peers to emulate. Health Check 1: Bank Concentration Banking concentration shows the value of the assets of the three largest commercial banks over the total industry assets. Studies have shown that more concentrated banking systems are less likely to suffer systemic crises. Chart 2 shows the bank concentration in SEA countries and US and Canada for comparison. Generally, SEA central banks are in favour of higher bank concentration for the aim of enhancing stability. In Indonesia, in addition to the 122 commercial banks that comprise the figures in Chart 2 and Table 1, there are more than thousands of rural banks, giving rise to a highly fragmented sector.
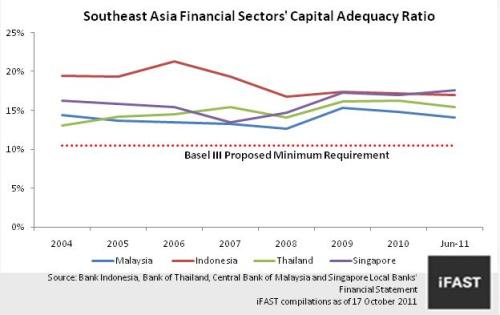
Health Check 2: Regulatory Capital Requirements One way to strengthen the financial sector is to ensure that it is adequately capitalised. Capital essentially serves as a cushion against losses. The level of capital required is laid out in Basel III, a regulatory standard on bank capital adequacy, which SEA financial regulatory authorities will be adopting in stages. Capital adequacy ratio (CAR) is calculated by taking Tier 1 and 2 capital (e.g. shareholder’s equity, retained earnings and allocated reserves) and dividing it by total risk-weighted assets. In Chart 2, we can see that the SEA financial sector’s CAR (using the less stringent Basel II definitions) is comfortably above Basel III’s target of 8.0% - 10.5% by 2019 (see Chart 3). The gradual adoption of Basel III will inevitably lower these CAR numbers (due to more stringent definitions) but we do not expect the financial sector to miss Basel III targets significantly. The medium-term impact of the Basel III adoption is generally negative to GDP growth as the banks need to catch-up to the targets sets.
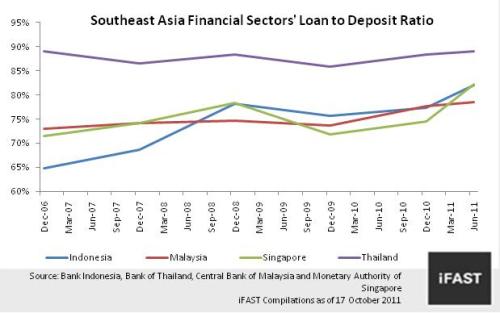
Health Check 3: Loan-to-Deposit Ratio A bank’s liquidity is traditionally measured by its loan-to-deposit ratio (simply, a bank’s total loans over total deposits). In Chart 4, Thailand’s loan-to-deposit ratio (LDR) was 89% in June 2011, the highest among its peers. A numbers of Thai banks have exceeded the 100% level which means that they rely on borrowings of funds from the wholesale markets. The risk of relying on wholesale fund is this: the liquidity of the wholesale market can dry up when other banks are unwilling to lend in times of heightened credit risk aversion, such as during the 2008 financial crisis and as recently faced by European continental banks. In June, Korea regulators have asked lenders in Korea to reduce their LDRs to below 100% from a high of 127% after the 2008 global financial crisis to contain the potential risk to financial instability.
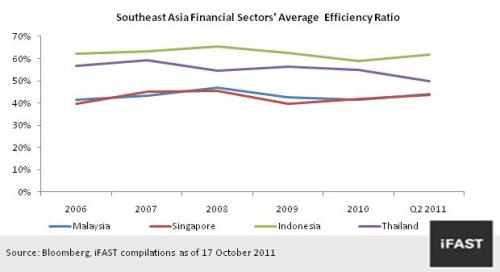
Health Check 4: Efficiency Test A bank’s efficiency is measured by the amount of operating cost needed to generate its operating income. A lower efficiency ratio implies better cost management. Over the years, Singapore and Malaysia’s financial sector averaged between 40 - 50 %. However, Thailand and Indonesia averaged between 50 - 60% for the past 5 years (Chart 5). Even though it is the highest among SEA countries, the efficiency ratio of Thailand’s financial sector has been improving over the years compared to the rest.
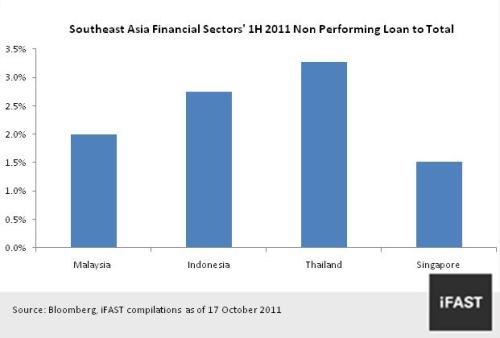
Health Check 5: Non-Performing Loan to Total Loan Ratio The quality of loans (the main portion of bank assets) remains at manageable levels in the four SEA countries (see chart 6). Current non-performing loan (NPL) levels are less likely to pose a threat to the financial sector given that regulation by central banks and accounting standards have become more stringent since the 2008 global financial crisis.
Summary of SEA Financial Sector Health Check This is summary of health check on respective financial sector health check. Table 2: Summary of Southeast Asia Financial Sectors' Health Check
Conclusion SEA financial sector is generally healthy with the respective local regulatory authorities proactive in managing systemic risks, having gone through the Asian Financial Crisis in 1997 and Global Financial Crisis in 2008. Related Fund OSK-UOB ASEAN FUNDOSK-UOB ASIA FINANCIALS FUND |
||||||||||||||||||||||||||||||||||||||||||||||||||||||||||||||||||||||||||||||||||||||||
| The Research Team is part of iFAST Capital Sdn Bhd | ||||||||||||||||||||||||||||||||||||||||||||||||||||||||||||||||||||||||||||||||||||||||
This article is not to be construed as an offer or solicitation for the subscription, purchase or sale of any fund. No investment decision should be taken without first viewing a fund's prospectus and if necessary, consulting with financial or other professional advisers. Any advice herein is made on a general basis and does not take into account the specific investment objectives of the specific person or group of persons. Past performance and any forecast is not necessarily indicative of the future or likely performance of the fund. The value of units and the income from them may fall as well as rise. Opinions expressed herein are subject to change without notice. Please read our disclaimer in the website. |
||||||||||||||||||||||||||||||||||||||||||||||||||||||||||||||||||||||||||||||||||||||||